Create an interactive loon 3d plot widget
l_plot3D.Rdl_plot3D is a generic function for creating interactive
visualization environments for R objects.
l_plot3D(x, y, z, axisScaleFactor, ...)
Arguments
| x | the x, y and z arguments provide the x, y and z coordinates for the plot. Any reasonable way of defining the coordinates is acceptable. See the function xyz.coords for details. If supplied separately, they must be of the same length. |
|---|---|
| y | the y coordinates of points in the plot, optional if x is an appropriate structure. |
| z | the z coordinates of points in the plot, optional if x is an appropriate structure. |
| axisScaleFactor | the amount to scale the axes at the centre of the rotation. Default is 1. All numerical values are acceptable (0 removes the axes, < 0 reverses their direction.) |
| ... | named arguments to modify plot states. |
Value
widget handle
Details
l_help() function call. The general direct manipulation and interaction gestures are
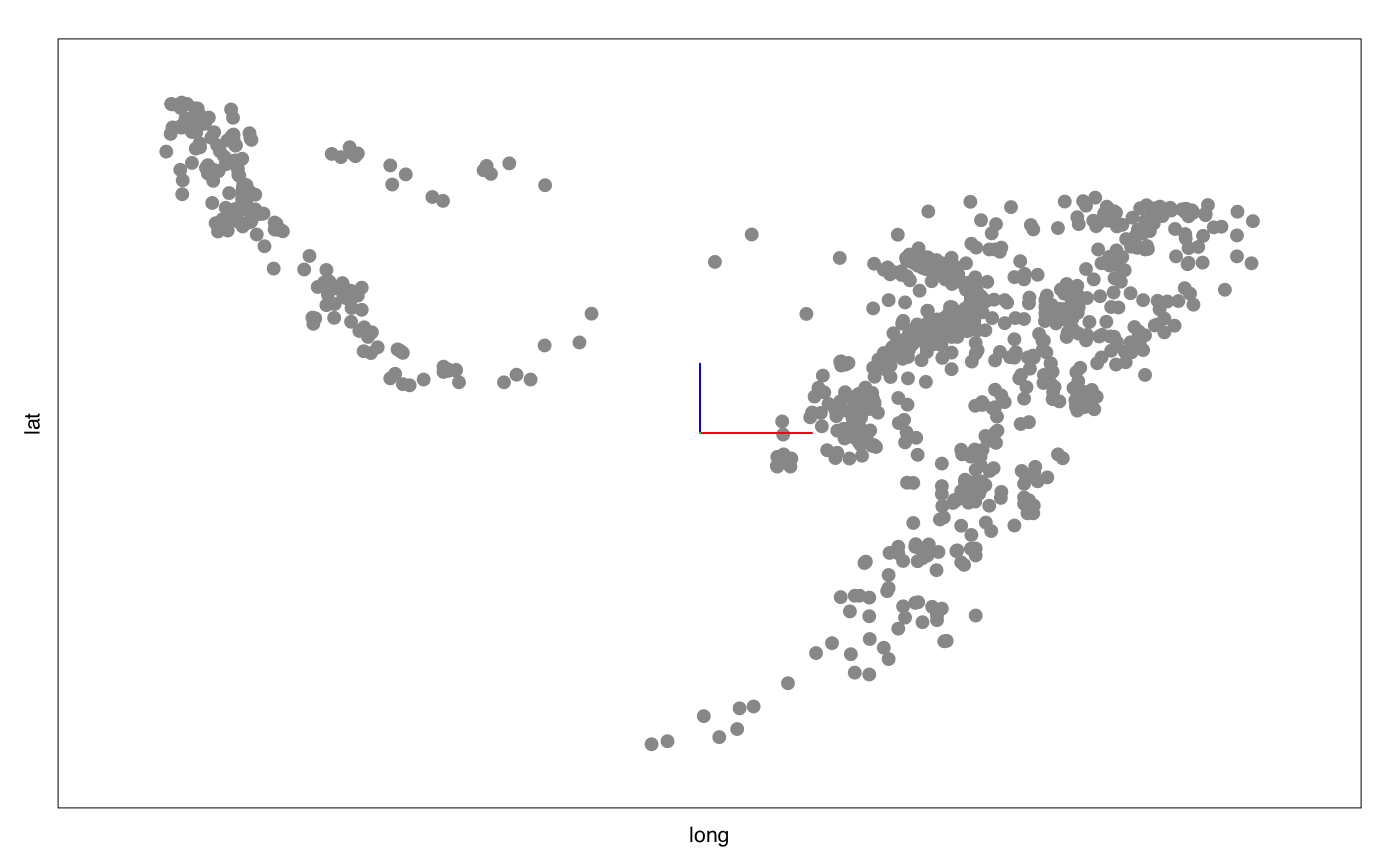
outlined in the following figures. Rotating Press 'R' to toggle rotation mode.
When rotation mode is active, either use the below mouse gestures or arrow keys to rotate the plot. 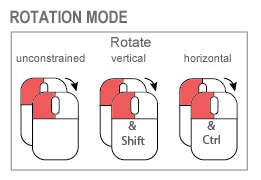 The centre of the rotation can be changed by panning the plot.
To reset the rotation, use the tripod icon in the plot inspector. Zooming and Panning
The centre of the rotation can be changed by panning the plot.
To reset the rotation, use the tripod icon in the plot inspector. Zooming and Panning 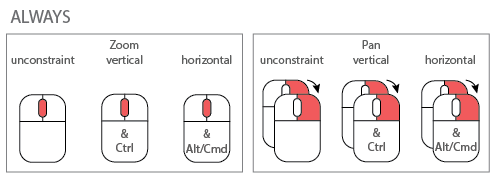 Selecting Points/Objects
 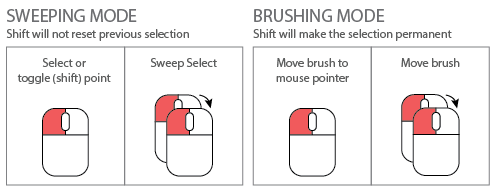 Moving Points on the Scatterplot Display
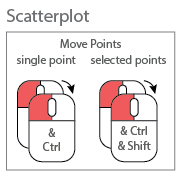
NOTE: Although it is possible to programmatically add layers to an l_plot3D, these will not appear as part of the 3D plot's display. There is no provision at present to incorporate rotation of 3D geometric objects other than point glyphs.
See also
Other three-dimensional plotting functions: l_plot3D.default,
l_scale3D
Examples
#> [1] ".l100.plot3D" #> attr(,"class") #> [1] "l_plot3D" "l_plot" "loon"#> [1] ".l101.plot3D" #> attr(,"class") #> [1] "l_plot3D" "l_plot" "loon"scaled_quakes <- l_scale3D(quakes) with(scaled_quakes, l_plot3D(long, lat, depth, linkingGroup = "quakes") )#> [1] ".l102.plot3D" #> attr(,"class") #> [1] "l_plot3D" "l_plot" "loon"#> [1] ".l103.plot3D" #> attr(,"class") #> [1] "l_plot3D" "l_plot" "loon"# Or together: with(scaled_quakes,{ l_plot3D(long, lat, depth, linkingGroup = "quakes") l_plot3D(mag, stations, depth, linkingGroup = "quakes") } )#> [1] ".l105.plot3D" #> attr(,"class") #> [1] "l_plot3D" "l_plot" "loon"# Get an R (grid) graphics plot of a loon plot p <- with(scaled_quakes, l_plot3D(long, lat, depth, linkingGroup = "quakes")) plot(p)# or to save the grid data structure (grob) for later use pg <- loonGrob(p) # Use with other tk widgets tt <- tktoplevel() p1 <- l_plot3D(parent=tt, x=c(1,2,3), y=c(3,2,1), z=c(1,2,3)) p2 <- l_plot3D(parent=tt, x=c(4,3,1), y=c(6,8,4), z=c(3,2,1)) tkgrid(p1, row=0, column=0, sticky="nesw")#> <Tcl>tkgrid(p2, row=0, column=1, sticky="nesw")#> <Tcl>tkgrid.columnconfigure(tt, 0, weight=1)#> <Tcl>tkgrid.columnconfigure(tt, 1, weight=1)#> <Tcl>tkgrid.rowconfigure(tt, 0, weight=1)#> <Tcl>tktitle(tt) <- "Loon plots with custom layout"