Display a Heat Image
l_layer_heatImage.RdThis function is very similar to the
image function. It works with every loon plot which
is based on the cartesian coordinate system.
l_layer_heatImage(widget, x = seq(0, 1, length.out = nrow(z)),
  y = seq(0, 1, length.out = ncol(z)), z,
  zlim = range(z[is.finite(z)]), xlim = range(x), ylim = range(y),
  col = grDevices::heat.colors(12), breaks, oldstyle = FALSE,
  useRaster, index = "end", parent = "root", ...)
Arguments
| widget | widget path as a string or as an object handle |
|---|---|
| x | locations of grid lines at which the values in z are measured. These must be finite, non-missing and in (strictly) ascending order. By default, equally spaced values from 0 to 1 are used. If x is a list, its components x$x and x$y are used for x and y, respectively. If the list has component z this is used for z. |
| y | see description for the |
| z | a numeric or logical matrix containing the values to be plotted
( |
| zlim | the minimum and maximum |
| xlim | range for the plotted x values, defaulting to the range of x |
| ylim | range for the plotted y values, defaulting to the range of y |
| col | a list of colors such as that generated by
|
| breaks | a set of finite numeric breakpoints for the colours: must have one more breakpoint than colour and be in increasing order. Unsorted vectors will be sorted, with a warning. |
| oldstyle | logical. If true the midpoints of the colour intervals
are equally spaced, and |
| useRaster | logical; if |
| index | position among its siblings. valid values are 0, 1, 2, ..., 'end' |
| parent | parent widget path |
| ... | argumnets forwarded to |
Value
layer id of group or rectangles layer
Details
For more information run: l_help("learn_R_layer.html#countourlines-heatimage-rasterimage")
Examples
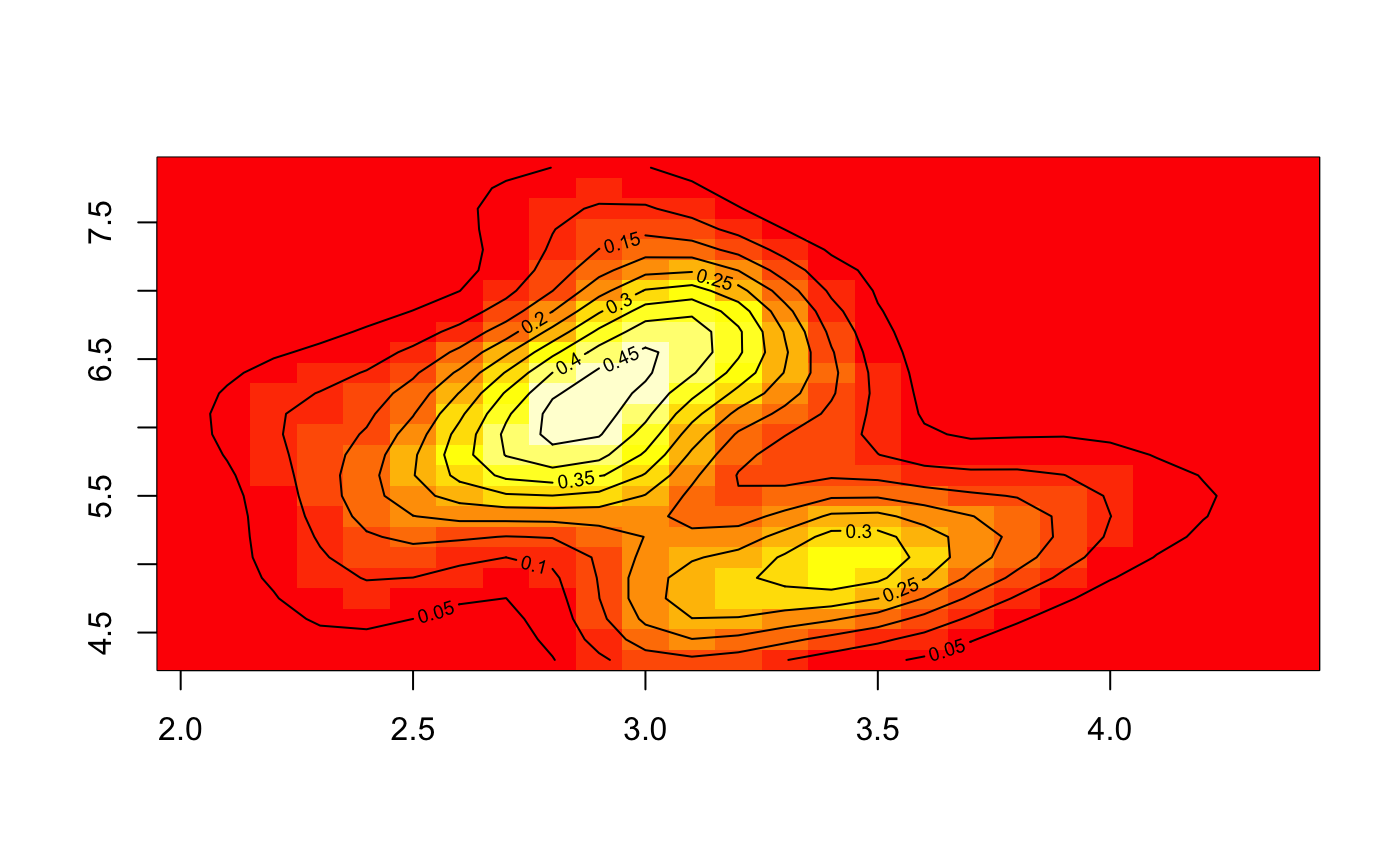
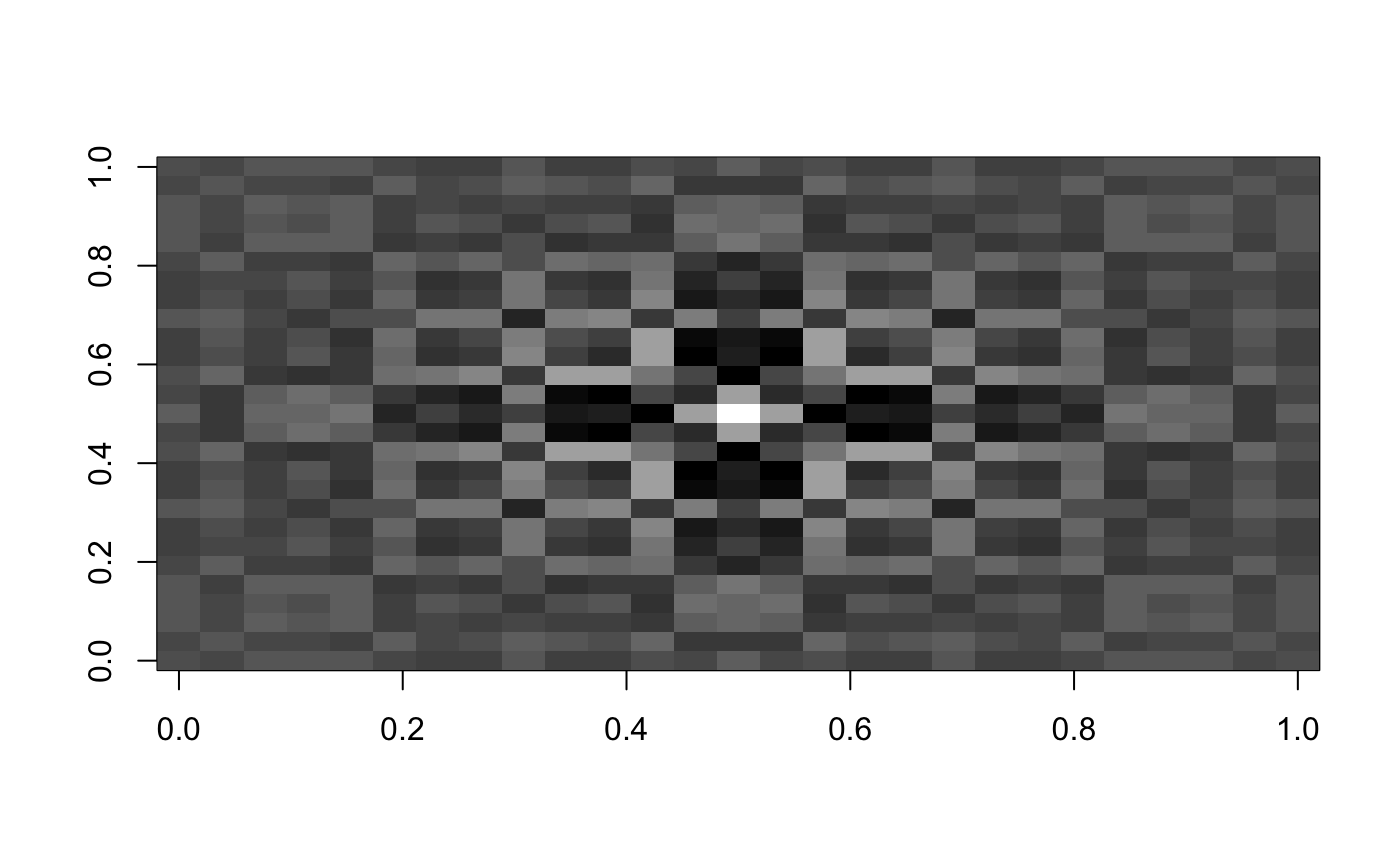
if (requireNamespace("MASS", quietly = TRUE)) { kest <- with(iris, MASS::kde2d(Sepal.Width,Sepal.Length)) image(kest) contour(kest, add=TRUE) p <- l_plot() lcl <- l_layer_contourLines(p, kest, label='contour lines') limg <- l_layer_heatImage(p, kest, label='heatmap') l_scaleto_world(p) }# from examples(image) x <- y <- seq(-4*pi, 4*pi, len = 27) r <- sqrt(outer(x^2, y^2, "+")) p1 <- l_plot() l_layer_heatImage(p1, z = z <- cos(r^2)*exp(-r/6), col = gray((0:32)/32))#> loon layer "rectangles" of type rectangles of plot .l63.plot #> [1] "layer0"