The default l_plot for plotting data
l_plot.default.RdCreates an interactive 2d scatterplot. Also, if no loon
inspector is open then the l_plot call will also open a loon
inspector.
# S3 method for default
l_plot(x, y = NULL, color = "grey60",
  glyph = "ccircle", size = 4, active = TRUE, selected = FALSE,
  xlabel, ylabel, title, showLabels = TRUE, showScales = FALSE,
  showGuides = TRUE, guidelines = "white",
  guidesBackground = "grey92", foreground = "black",
  background = "white", parent = NULL, ...)
Arguments
| x | the |
|---|---|
| y | argument description is as for the |
| color | colours of points (default "grey60"); colours are repeated until matching the number points, |
| glyph | shape of point; must be one of the primitive glyphs "circle", "ccircle", "ocircle", "square", "csquare", "osquare", "triangle", "ctriangle", "otriangle", "diamond", "cdiamond", or "odiamond". Prefixes "c" and "o" mean closed and open, respectively. Default is "ccircle" meaning a closed circle glyph. Non-primitive glyphs such as polygons, images, text, point ranges, and even interactive glyphs like serial axes glyphs may be added, but only after the plot has been created. |
| size | size of the symbol (roughly in terms of area) |
| active | a logical determining whether points appear or not (default is TRUE for all points). If a logical vector is given of length equal to the number of points, then it identifies which points appear (TRUE) and which do not (FALSE). |
| selected | a logical determining whether points appear selected at first (default is FALSE for all points). If a logical vector is given of length equal to the number of points, then it identifies which points are (TRUE) and which are not (FALSE). |
| xlabel | Label for the horizontal (x) axis. If missing,
one will be inferred from |
| ylabel | Label for the vertical (y) axis. If missing,
one will be inferred from |
| title | Title for the plot, default is an empty string. |
| showLabels | logical to determine whether axes label (and title) should be presented. |
| showScales | logical to determine whether numerical scales should be presented on both axes. |
| showGuides | logical to determine whether to present background guidelines to help determine locations. |
| guidelines | colour of the guidelines shown when |
| guidesBackground | colour of the background to the guidelines shown when
|
| foreground | foreground colour used by all other drawing (default "black"). |
| background | background colour used for the plot (default "white") |
| parent | a valid Tk parent widget path. When the parent widget is
specified (i.e. not |
| ... | named arguments to modify plot states. |
Details
The scatterplot displays a number of direct interactions with the
mouse and keyboard, these include: zooming towards the mouse cursor using
the mouse wheel, panning by right-click dragging and various selection
methods using the left mouse button such as sweeping, brushing and
individual point selection. See the documentation for l_plot
for more details about the interaction gestures.
See also
Other two-dimensional plotting functions: l_plot.decomposed.ts,
l_plot.density, l_plot.stl,
l_plot
Other loon interactive states: l_info_states,
l_plot, l_state_names,
names.loon
Examples
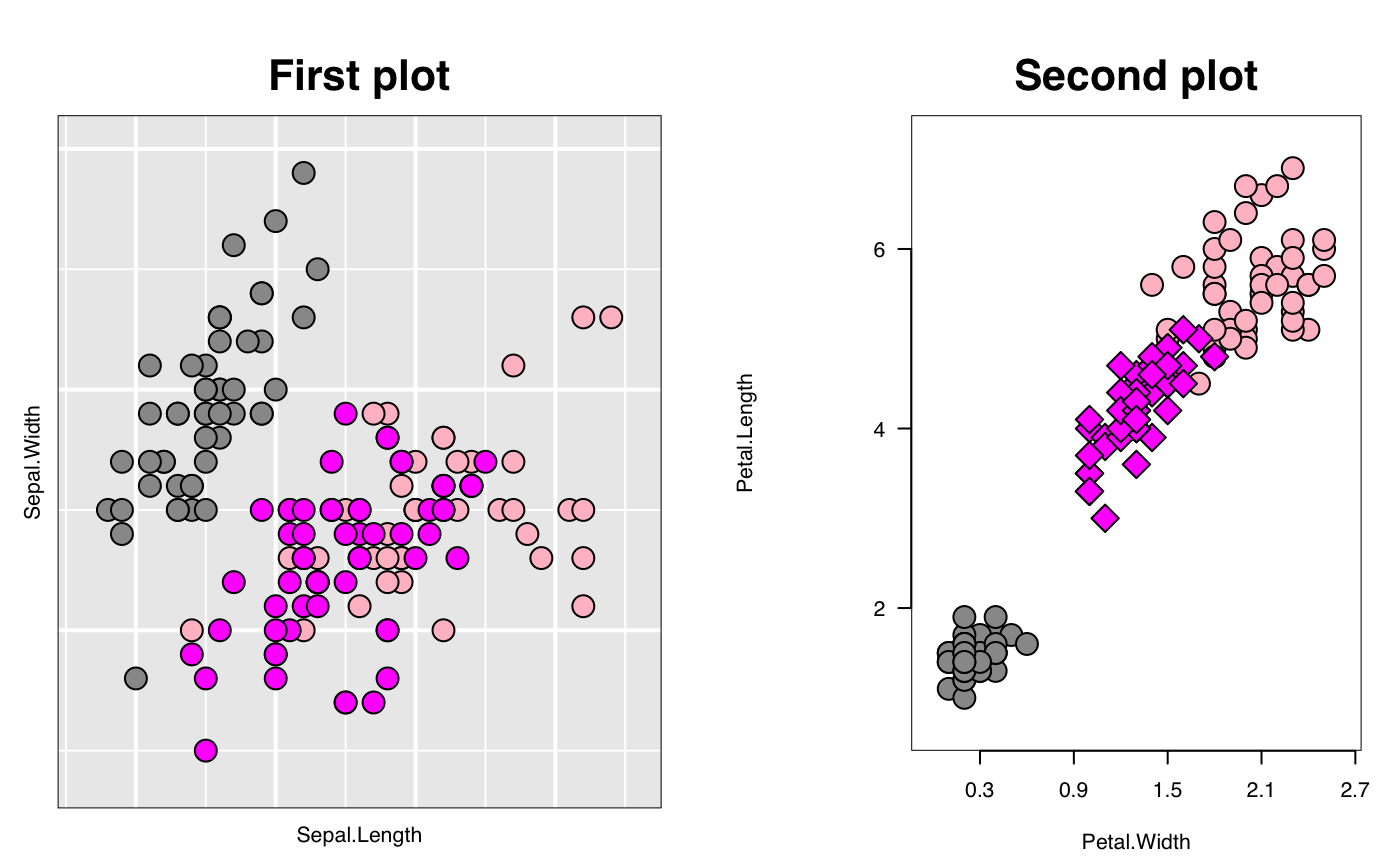
# default use as scatterplot p1 <- with(iris, l_plot(Sepal.Length, Sepal.Width, color=Species, title = "First plot")) # The names of the info states that can be # accessed or set. They can also be given values as # arguments to l_plot.default() names(p1)#> [1] "glyph" "itemLabel" "showItemLabels" "linkingGroup" #> [5] "linkingKey" "zoomX" "zoomY" "panX" #> [9] "panY" "deltaX" "deltaY" "xlabel" #> [13] "ylabel" "title" "showLabels" "showScales" #> [17] "swapAxes" "showGuides" "background" "foreground" #> [21] "guidesBackground" "guidelines" "minimumMargins" "labelMargins" #> [25] "scalesMargins" "x" "y" "xTemp" #> [29] "yTemp" "color" "selected" "active" #> [33] "size" "tag" "useLoonInspector" "selectBy" #> [37] "selectionLogic"p1["size"] <- 10 p2 <- with(iris, l_plot(Petal.Length ~ Petal.Width, linkingGroup="iris_data", title = "Second plot", showGuides = FALSE)) p2["showScales"] <- TRUE # link first plot with the second plot requires # l_configure to coordinate the synchroniztion l_configure(p1, linkingGroup = "iris_data", sync = "push") p1['selected'] <- iris$Species == "versicolor" p2["glyph"][p1['selected']] <- "cdiamond" gridExtra::grid.arrange(loonGrob(p1), loonGrob(p2), nrow = 1)# Use with other tk widgets tt <- tktoplevel() tktitle(tt) <- "Loon plots with custom layout" p1 <- l_plot(parent=tt, x=c(1,2,3), y=c(3,2,1)) p2 <- l_plot(parent=tt, x=c(4,3,1), y=c(6,8,4)) tkgrid(p1, row=0, column=0, sticky="nesw")#> <Tcl>tkgrid(p2, row=0, column=1, sticky="nesw")#> <Tcl>tkgrid.columnconfigure(tt, 0, weight=1)#> <Tcl>tkgrid.columnconfigure(tt, 1, weight=1)#> <Tcl>tkgrid.rowconfigure(tt, 0, weight=1)#> <Tcl>